

In today’s fast-paced digital landscape, real-time resource monitoring is no longer optional — it’s essential. It enables organizations to detect performance bottlenecks, reduce downtime, and optimize system efficiency proactively.
This article explores the significance of real-time resource tracking and showcases practical ways to implement it using industry-leading tools like Grafana, Dynatrace, and Datadog. We’ll also look at how default metrics can be enriched with custom solutions using Prometheus and Python — including a script to monitor the top 10 CPU-consuming processes in real time.
From understanding the business use cases to setting up alerting and comparing the flexibility of monitoring platforms, this guide aims to help you choose the right tools and approach for your needs.

In today’s dynamic digital landscape, real-time resource monitoring is essential for identifying, understanding, and addressing system performance issues. While modern tools like Dynatrace provide a robust set of default metrics, they may not cover every unique use case. This gap highlights the increasing need for customizable resource monitoring solutions that allow businesses to track specific metrics beyond those pre-configured in commercial software.
For instance, the portal may display peak concurrent user stats through a dedicated API. However, integrating such a custom metric into a broader monitoring solution can be challenging. In such cases, having the flexibility to send targeted, custom metrics—like user concurrency, API limits, or other stats—into the monitoring tool becomes invaluable.
Key Benefits for Businesses:
- Proactive Issue Resolution: Quickly identify and fix performance issues to avoid downtime.
- Optimized Resource Utilization: Allocate resources efficiently, reducing waste and costs.
- Improved Customer Experience: Ensure system reliability for seamless user satisfaction.
- Informed Decision-Making: Real-time data aids in adapting to changes effectively.
Below is a comparison of scenarios where real-time resource tracking is essential and where it may not be necessary:
| Business Function | Scenarios Where Real-Time Tracking Is Essential | Instances Where It May Not Be Necessary |
|---|---|---|
| Server and Network Metrics | Monitoring servers and network infrastructure to prevent downtime. Example: Use Grafana to alert when CPU usage exceeds 90%. | Low-activity systems like rarely accessed databases. Example: A backup database accessed only once a month. |
| Customer Delivery Network | Tracking server loads during peak traffic to ensure seamless transactions. Example: Monitoring website load time during Black Friday sales. | Historical analysis where long-term insights are the priority. Example: Analyzing sales trends over the past year. |
| Application Delivery / Production Deployment | Detecting and resolving issues in automated builds and deployments in real time. Example: Noticing and fixing a failed software update instantly. | Small-scale projects with predictable workflows. Example: A single-developer project with limited deployments. |
| Logistics Optimization | Tracking fleet movements to optimize delivery times. Example: Using GPS tracking to monitor delivery trucks in real time for efficient routing. | Resource-limited settings where cost of real-time tracking is unjustified. Example: Local courier service with fixed routes. |
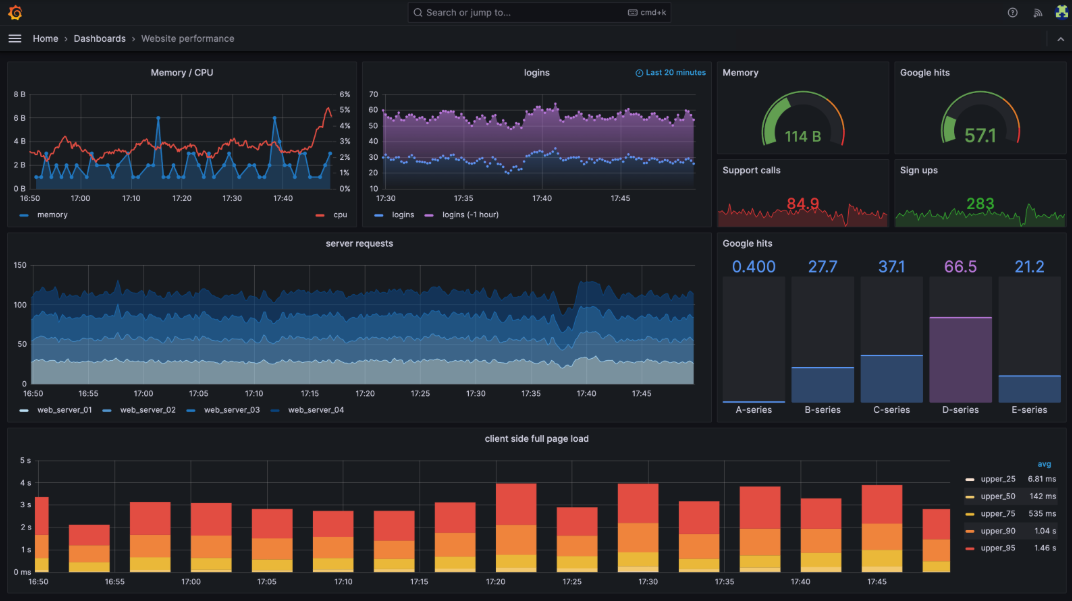
In this section, we'll cover the process of implementing real-time resource monitoring using Grafana and Dynatrace. This includes steps for configuring custom metrics, creating insightful dashboards, and setting up alerts to ensure proactive system management. Whether you're monitoring Grafana dashboards or automating insights with Dynatrace, these tools streamline performance tracking. Let's get started!
Set Up Grafana with Custom Metrics
- Install and configure Grafana on your server or cloud instance.
- Integrate Prometheus as a data source to collect custom metrics.

- Illustrating a Practical Example: To track the top 10 CPU-consuming processes in real-time, use the following Linux command:
ps -eo pid,cmd:500,%cpu --sort=-%cpu | head -n 10
-
Breakdown:
- pid: Displays the Process ID.
- cmd:500: Shows the command name with arguments, limited to 500 characters.
- %cpu: CPU usage for each process.
- --sort=-%cpu: Sorts processes in descending order of CPU usage.
- head -n 10: Displays the top 10 processes.
-
Create a Python script to automate the command execution, parse the output, and send the metrics to Prometheus:
<Python code block>
import subprocess
import requests

# Define the Prometheus Pushgateway endpoint

PROMETHEUS_ENDPOINT = "https://localhost:9091/metrics/job/cpu_usage"

def get_cpu_usage():
    # Run the `ps` command and capture the output directly
    result = subprocess.run(
        "ps -eo pid,cmd:500,%cpu --sort=-%cpu | head -n 10",
         shell=True,
         text=True,
         capture_output=True,
    )
    return result.stdout.strip()
def send_to_prometheus(data):
    """
    Send the raw data directly to the Prometheus Pushgateway.
    """
    response = requests.post(PROMETHEUS_ENDPOINT, data=data)
    if response.status_code == 200:
        print("Data successfully sent to Prometheus.")
    else:
        print(
            f"Failed to send data. Status code: {response.status_code}, Response: {response.text}" )

def main():

    # Get the CPU usage data and send it to Prometheus
    send_to_prometheus(get_cpu_usage())

if __name__ == "__main__":
    main()
This script pushes the top 10 CPU-consuming process metrics to the Prometheus Pushgateway, where Grafana can visualize them as a line graph.
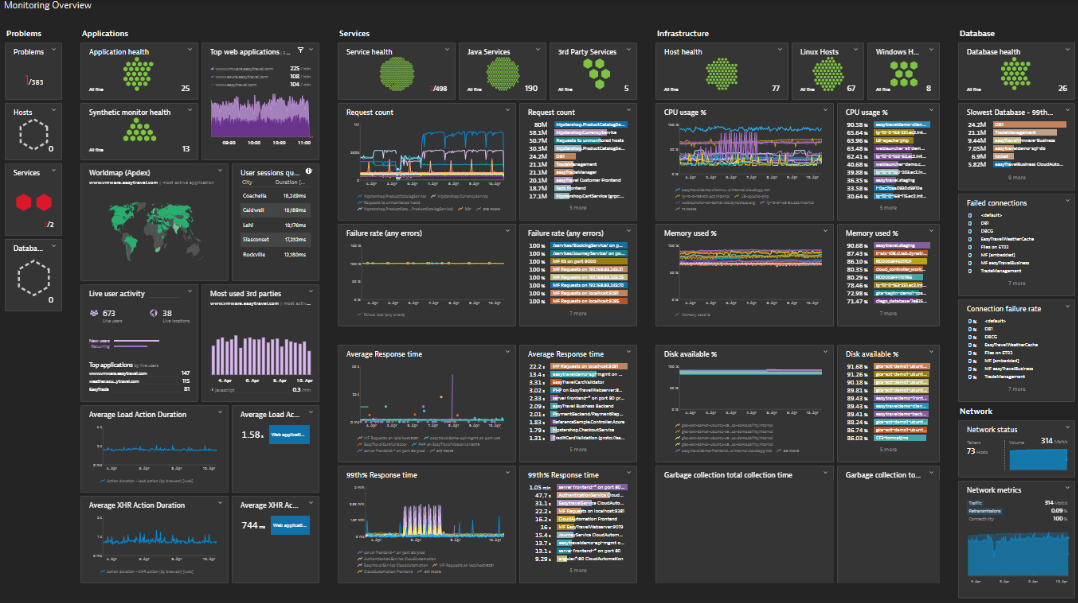
Set Up Dynatrace for Advanced Monitoring
Dynatrace dashboards provide centralized access to real-time performance data, enabling users to configure monitoring, track CPU usage, and set up actionable alerts with ease.
-
Deploy Dynatrace OneAgent: Install the Dynatrace agent on relevant infrastructure components (e.g., servers, applications). Navigate to the Hosts section in Dynatrace to view real-time system performance data and select a specific server to drill down into process-level details.
-
Set Up CPU Monitoring: Go to Transactions & Services → Process Group Monitoring and Enable Custom Process Monitoring to track specific CPU-intensive applications.
-
Create a Custom Dashboard for CPU Usage: Open Dashboards → Create Dashboard and Add a new Custom Chart widget. Set the metric to Process CPU Usage (%), Apply a filter to show the Top 10 CPU-consuming processes. Adjust the time range to display real-time data.
-
Set Up Alerts for High CPU Consumption: Navigate to Settings → Anomaly Detection → CPU Usage, Define a threshold (e.g., alert if CPU usage exceeds 80% for over 5 minutes). Enable notifications via email, Slack, or a webhook for instant alerts.
Automated alerting helps teams quickly respond to abnormal behaviors by sending real-time notifications when key metrics exceed predefined thresholds. Critical metrics like CPU usage, memory utilization, response time, and error rates play a pivotal role in maintaining smooth operations. Configuring alerts for these metrics ensures proactive issue detection, minimizing downtime and safeguarding system performance.
To achieve effective automated alerting, it is essential to define and monitor these key metrics. Examples include:
- CPU Usage (e.g., alert when CPU usage exceeds 90%)
- Memory Utilization (e.g., warn if RAM usage is consistently above 80%)
- Response Time (e.g., flag API calls exceeding a 3-second response time)
- Error Rates (e.g., detect an increase in failed requests)

Configuring Alerts in Grafana-
Grafana simplifies monitoring through customizable alerting rules, allowing users to efficiently track key metrics like CPU usage. By integrating Grafana and Prometheus, and crafting precise queries, teams can leverage alerting with Grafana to ensure prompt issue detection and proactive resource management.
Example: CPU Usage Alert in Grafana
- Navigate to Alerting → Alert Rules in Grafana.
- Click "Create a new alert rule" and select the Prometheus data source.
- Use PromQL query to trigger an alert when CPU usage exceeds 90%:
avg(rate(node_cpu_seconds_total{mode="user"}[5m])) * 100 > 90 - Define the alert condition (e.g., trigger if the threshold is breached for 5 minutes).
- Configure notification channels (e.g., Slack, email, or PagerDuty).
- Save the alert and test it by generating high CPU usage on a test server.
Configuring Notifications in Grafana
- Go to Alerting → Notification Channels.
- Add a new channel (e.g., Slack).
- Enter the Slack Webhook URL and set the message format:
{ "channel": "#alerts", "text": "🚨 High CPU Usage Alert: Server XYZ is at 95% CPU!" }
- Test the notification and save the settings.
Configuring Alerts in Dynatrace
Dynatrace monitoring leverages AI to detect anomalies by learning baseline system behaviors and identifying deviations in real-time.
Example: Response Time Alert in Dynatrace
- Go to Settings → Anomaly Detection → Custom Alerts in Dynatrace.
- Select "Web Service Response Time" as the monitored metric.
- Set the alert threshold (e.g., trigger an alert when response time exceeds 3 seconds for 5 consecutive minutes).
- Define alert sensitivity (static threshold or dynamic anomaly detection).
- Choose a notification method (Dynatrace App, Slack, email, or integration with Jira).
- Deploy the alert and observe performance over time.

Configuring Notifications in Dynatrace
- Go to Settings → Alerting Profiles.
- Set up priority-based notifications (e.g., Critical alerts → PagerDuty, Warning alerts → Slack).
- Enable alert correlation to prevent duplicate notifications.
💡Additional Features: Apart from this, Dynatrace offers advanced AI-driven features, such as auto-adaptive threshold monitoring, anomaly correlation, and root cause analysis, enabling more intelligent and proactive system management.
This section provides a feature-by-feature comparison of Grafana, Dynatrace, and Datadog to help identify the best fit for your monitoring needs.
| Feature | Grafana | Dynatrace | Datadog |
|---|---|---|---|
| Primary Focus | Visualization and dashboard creation for metrics from various data sources. | AI-driven monitoring with automated anomaly detection and root cause analysis. | Comprehensive observability platform with strong infrastructure monitoring. |
| Ease of Setup | Requires manual configuration for dashboards. | Auto-discovery & monitoring with minimal setup. | Agent-based setup with automated configurations. |
| Custom Metrics | Highly customizable dashboards; integrates well with Prometheus. | Limited customization; focuses on automated insights. | Supports custom metrics but requires additional configuration. |
| Alerting | Custom alerting based on defined rules. | Automated alerts with AI-driven insights. | Real-time alerts with security compliance monitoring. |
| AI & Anomaly Detection | No built-in AI; relies on integrations. | AI-powered anomaly detection and root cause analysis. | Uses ML-based anomaly detection. |
| Service Level Objectives (SLO) | Limited in-built support; can be configured using Prometheus and external tools. | Built-in SLO tracking with automated performance baselines. | Comprehensive SLO tracking integrated with security and compliance metrics. |
| Integration | Integrates with Prometheus, InfluxDB, and other open-source tools. | Integrates with enterprise tools like ServiceNow and AWS. | Offers extensive integration, including cloud platforms and DevOps tools. |
| Special Features | Open source; supports plugins for extended functionality. | AI-driven insights; automatic dependency mapping. | Full-stack observability; strong security monitoring capabilities. |
| Pricing | Free and open source; paid enterprise version available. | Premium pricing; tailored for large enterprises. | Subscription-based; flexible plans for small to large organizations. |
| Best Use Case | Ideal for teams needing flexible, open-source visualization tools. | Best for enterprises requiring automated monitoring and AI-driven insights. | Suitable for organizations seeking a unified observability platform. |

This section outlines the advanced functionalities that make modern monitoring tools more efficient, insightful, and easy to integrate.
| Feature | Description |
|---|---|
| API Health Monitoring | Tracks response times, error rates, and latency to ensure API reliability. |
| Kubernetes Instance Monitoring | Provides real-time insights into pod utilization, resource allocation, and cluster health. |
| HTTP Error Tracking | Monitors 404s, 500s, and other HTTP errors for quick issue resolution. |
| Ease of Integration | Seamlessly connects with tools like Jira, Slack, and PagerDuty for streamlined workflows. |
| Service Level Objectives | Tracks KPIs like uptime and response time to ensure performance goals are met. |
| AI Powered Insights | Uses machine learning for anomaly detection, predictive alerts, and automated root cause analysis. |
Real-time resource monitoring is essential for maintaining system performance, ensuring uptime, and responding proactively to potential issues. The right solution depends on your organization’s scale, infrastructure, and specific monitoring goals.

-
Open-Source Flexibility For teams looking to leverage cost-effective and adaptable monitoring tools, Grafana open source stands out with its powerful visualization capabilities and seamless compatibility with Prometheus, InfluxDB, and other data sources. This solution is ideal for those who prioritize customizability, scalability, and the benefits of community-driven innovation.
-
Plug-and-Play Monitoring Solutions
If you prefer an automated, out-of-the-box experience with minimal setup, tools like Dynatrace deliver intelligent monitoring with AI-powered anomaly detection and root cause analysis and real user monitoring Dynatrace capabilities. Best suited for enterprises that require deep insights without heavy configuration overhead. -
Cloud-Native Monitoring Platforms Organizations operating in cloud-first environments will benefit from tools like Datadog, which provide end-to-end visibility across multi-cloud infrastructures, along with built-in security, compliance, and seamless integrations with AWS, Azure, and GCP.
Regardless of the tool you choose, adopting a real-time resource monitoring strategy enables teams to proactively address issues, enhance system performance, and make informed decisions that drive reliability and scalability.
Author- Shubham Gulati is a Platform Engineer with 9 years of experience, currently part of the Test Data Management team. He specializes in test automation, platform stability, ETL disaster recovery, and enterprise monitoring, with a strong focus on Dynatrace, data acquisition, and compliance. Outside of work, he enjoys cycling and playing video games.


Blogs you may like
There are no more blogs for this category